- Tracking model performance regressions
- Coordinating shared evaluation workflows
Create a Leaderboard
You can create a leaderboard via the Weave UI or programmatically.Using the UI
To create and customize leaderboards directly in the Weave UI:- In the Weave UI, Navigate to the Leaders section. If it’s not visible, click More → Leaders.
- Click + New Leaderboard.
- In the Leaderboard Title field, enter a descriptive name (e.g.,
summarization-benchmark-v1). - Optionally, add a description to explain what this leaderboard compares.
- Add columns to define which evaluations and metrics to display.
- Once you’re happy with the layout, save and publish your leaderboard to share it with others.
Add columns
Each column in a leaderboard represents a metric from a specific evaluation. To configure a column, you specify:- Evaluation: Select an evaluation run from the dropdown (must be previously created).
- Scorer: Choose a scoring function (e.g.,
jaccard_similarity,simple_accuracy) used in that evaluation. - Metric: Choose a summary metric to display (e.g.,
mean,true_fraction, etc.).
⋯) on the right. You can:
- Move before / after – Reorder columns
- Duplicate – Copy the column definition
- Delete – Remove the column
- Sort ascending – Set the default sort for the leaderboard (click again to toggle descending)
Python
Looking for a complete, runnable code sample? See the End-to-end Python example.
-
Define a test dataset. You can use the built-in
Dataset, or define a list of inputs and targets manually: -
Define one or more scorers:
-
Create an
Evaluation: -
Define models to be evaluated:
-
Run the evaluation:
-
Create the leaderboard:
-
Publish the leaderboard.
-
Retrieve the results:
End-to-End Python example
The following example uses Weave Evaluations and creates a leaderboard to compare three summarization models on a shared dataset using a custom metric. It creates a small benchmark, evaluates each model, scores each model with Jaccard similarity, and publishes the results to a Weave leaderboard.View and interpret the Leaderboard
After the script finishes running, view view the leaderboard:- In the Weave UI, go to the Leaders tab. If it’s not visible, click More, then select Leaders.
- Click on the name of your leaderboard—e.g.
Summarization Model Comparison.
model_humanlike, model_vanilla, model_messy). The mean column shows the average Jaccard similarity between the model’s output and the reference summaries.
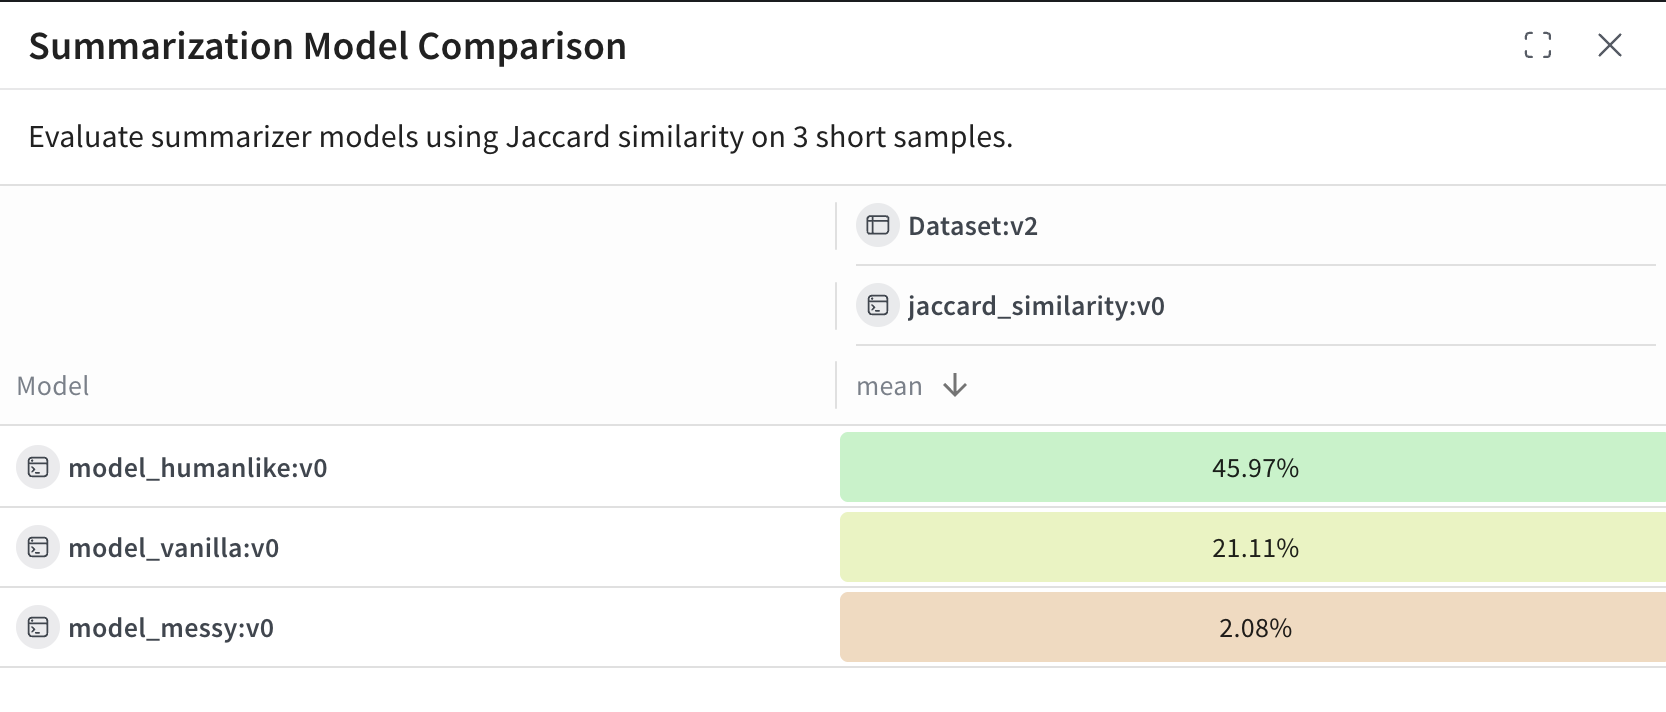
model_humanlikeperforms the best, with ~46% overlap.model_vanilla(a naive truncation) gets ~21%.model_messyan intentionally bad model, scores ~2%.